Figures
Constants and utility functions related to making figures.
API Documentation
- class oi_tools.figures.OIColors
Main Opportunity Insights color scheme.
- BLUE = '#0073A2'
- DARK_GREEN = '#2B8F43'
- LIGHT_GREEN = '#6BBD45'
- LIME_GREEN = '#A4CE4E'
- NAVY = '#003A4F'
- ORANGE = '#FAA523'
- PURPLE = '#7F4892'
- RED = '#E54060'
- TEAL = '#29B6A4'
- YELLOW = '#FFD400'
- classmethod dict(
- lowercase: bool = False,
Return all OI colors as a mapping of name to hex code.
- Parameters:
lowercase (bool) – If
True, return lowercase color names.- Returns:
Mapping of color name to hex code.
- Return type:
Examples
>>> OIColors.dict()["TEAL"]
'#29B6A4'
>>> OIColors.dict(lowercase=True)["teal"]
'#29B6A4'
- classmethod list() Sequence[str]
Return all OI colors as an ordered list.
- Returns:
Hex color codes in order.
- Return type:
Sequence[str]
Examples
>>> OIColors.list()[:2]
['#29B6A4', '#FAA523']
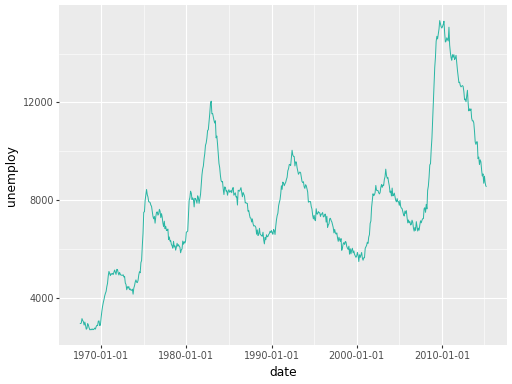
- classmethod primary() str
Get the primary OI color.
- Returns:
Hex color code for the primary color (teal).
- Return type:
Examples
import plotnine as pn
from plotnine.data import economics
from oi_tools.figures import OIColors

p = (
    pn.ggplot(economics, pn.aes("date", "unemploy"))
    + pn.geom_line(color=OIColors.primary())
)
p.show()
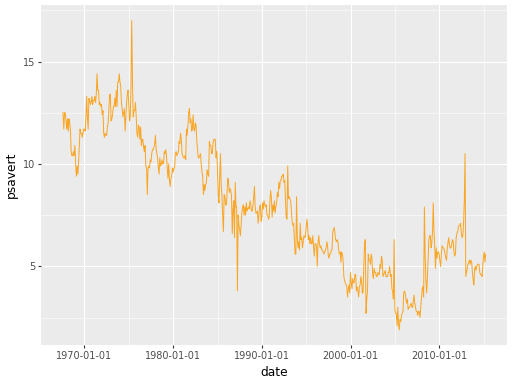
- classmethod secondary() str
Get the secondary OI color.
- Returns:
Hex color code for the secondary color (orange).
- Return type:
Examples
import plotnine as pn
from plotnine.data import economics
from oi_tools.figures import OIColors

p = (
    pn.ggplot(economics, pn.aes("date", "psavert"))
    + pn.geom_line(color=OIColors.secondary())
)
p.show()
- oi_tools.figures.save_figure(
- figure: ggplot,
- path: Path,
- *,
- filetype: str | Collection[str] = ['.pdf', '.svg', '.png'],
- **kwargs,
Save a single figure to one or more file formats.
- Parameters:
figure (ggplot) – The figure to save.
path (Path) – Destination path without extension.
filetype (str | Collection[str]) – File extension(s) to save. Defaults to
DEFAULT_FILETYPES.**kwargs – Additional keyword arguments passed to
figure.save.
- Return type:
None
Examples
>>> fig = pn.ggplot() + pn.geom_blank()
>>> save_figure(fig, "output/my_figure")
- oi_tools.figures.save_figures_to_folder(
- figures: Mapping[str | Path, ggplot],
- *,
- folder: Path | str = 'figures',
- filetype: str | Collection[str] = ['.pdf', '.svg', '.png'],
- use_subfolders: bool = False,
- **kwargs,
Save multiple named figures to a folder.
- Parameters:
figures (Mapping[str | Path, ggplot]) – A mapping of file names to figures.
folder (Path | str) – Destination folder. Defaults to
"figures".filetype (str | Collection[str]) – File extension(s) to save. Defaults to
DEFAULT_FILETYPES.use_subfolders (bool) – If
True, save each figure to its own subfolder.**kwargs – Additional keyword arguments passed to
save_figure.
- Return type:
None
Examples
>>> fig1 = pn.ggplot() + pn.geom_blank()
>>> fig2 = pn.ggplot() + pn.geom_blank()
>>> save_figures_to_folder(
...     {"fig1": fig1, "fig2": fig2}, folder="output/"
... )
- oi_tools.figures.save_figures_to_pdf(
- figures: Iterable[Any | ggplot | Figure | DataFrame],
- path: Path | str,
- *,
- width: int | float = 11,
- height: int | float = 8.5,
Save multiple figures to a single PDF file.
- Parameters:
- Return type:
None
Examples
>>> import matplotlib.pyplot as plt
>>> mpl_fig, _ = plt.subplots()
>>> pn_fig = pn.ggplot() + pn.geom_blank()
>>> side_by_side = pn_fig | pn_fig
>>> df = pl.DataFrame({"x": range(3), "y": "abc"})
>>> save_figures_to_pdf(
...     [mpl_fig, pn_fig, side_by_side, df],
...     "/tmp/oi-tools/figs.pdf",
... )
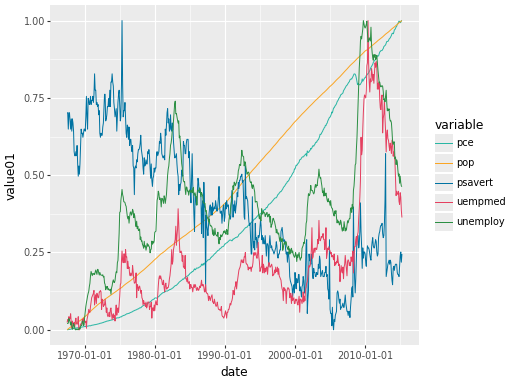
- oi_tools.figures.scale_color_oi(
- **kwargs,
Create a custom OI color scale for plotnine.
- Parameters:
**kwargs – Additional keyword arguments passed to
pn.scale_color_manual.- Returns:
A plotnine color scale using the OI color palette.
- Return type:
pn.scale_color_manual
Examples
import plotnine as pn
from plotnine.data import economics_long
from oi_tools.figures import scale_color_oi

p = (
    pn.ggplot(economics_long, pn.aes("date", "value01", color="variable"))
    + pn.geom_line()
    + scale_color_oi()
)
p.show()
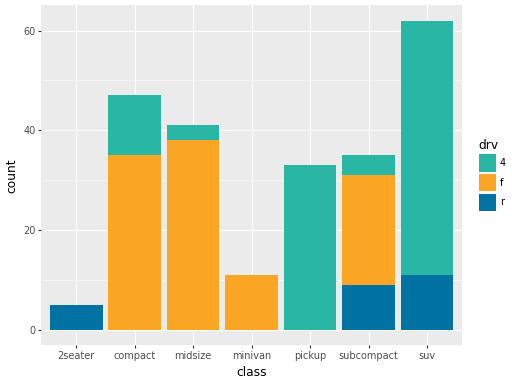
- oi_tools.figures.scale_fill_oi(
- **kwargs,
Create a custom OI fill scale for plotnine.
- Parameters:
**kwargs – Additional keyword arguments passed to
pn.scale_fill_manual.- Returns:
A plotnine fill scale using the OI color palette.
- Return type:
pn.scale_fill_manual
Examples
import plotnine as pn
from plotnine.data import mpg
from oi_tools.figures import scale_fill_oi

p = (
    pn.ggplot(mpg, pn.aes("class", fill="drv"))
    + pn.geom_bar()
    + scale_fill_oi()
)
p.show()
- oi_tools.figures.set_default_filetypes(
- filetypes: Collection[str],
Set the default file types used when saving figures.
- Parameters:
filetypes (Collection[str]) – File extensions to use by default (e.g.
[".pdf", ".png"]).- Return type:
None
Examples
>>> set_default_filetypes([".png"])
>>> DEFAULT_FILETYPES
['.png']
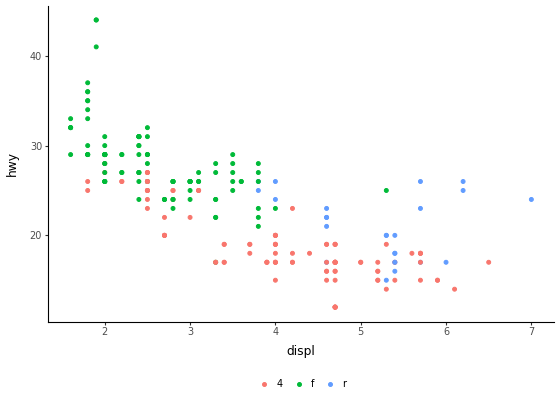
- oi_tools.figures.theme_oi(
- base_size: int = 11,
- base_family: str = 'DejaVu Sans',
- width: int | float = 7,
- height: int | float = 5,
Create the standard Opportunity Insights plotnine theme.
- Parameters:
- Returns:
A plotnine theme object.
- Return type:
pn.theme
Examples
import plotnine as pn
from plotnine.data import mpg
from oi_tools.figures import theme_oi

p = (
    pn.ggplot(mpg, pn.aes("displ", "hwy", color="drv"))
    + pn.geom_point()
    + theme_oi()
)
p.show()
- oi_tools.figures.view_colors(
- colors: Sequence[str] | Mapping[str, str] = {'BLUE': '#0073A2', 'DARK_GREEN': '#2B8F43', 'LIGHT_GREEN': '#6BBD45', 'LIME_GREEN': '#A4CE4E', 'NAVY': '#003A4F', 'ORANGE': '#FAA523', 'PURPLE': '#7F4892', 'RED': '#E54060', 'TEAL': '#29B6A4', 'YELLOW': '#FFD400'},
- show: bool = False,
Create a plotnine figure showing the specified colors.
- Parameters:
- Returns:
A plotnine figure with one tile per color.
- Return type:
pn.ggplot
Examples
>>> type(view_colors(["#29B6A4", "#FAA523"])).__name__
'ggplot'